
Most MLM software companies sell reporting as a feature checkbox. “200+ reports included.” That number means nothing. I have seen platforms with 200 reports where none of them answer the one question that actually matters: is this network growing or shrinking, and why?
In my project at FlawlessMLM, I spent the last two years analyzing which metrics correlate most strongly with network growth across our 400+ client base. The results surprised me. Revenue and distributor count, the two numbers every founder watches obsessively, are lagging indicators. They tell you what already happened. By the time revenue drops, the underlying cause started 60 to 90 days earlier in metrics that most platforms do not even track.
This guide shares the five leading indicators we discovered, explains how to build reporting dashboards that surface them, and shows what happens when a company starts managing by prediction instead of reaction. If you are evaluating MLM software for your network, the reporting capabilities should weigh as heavily as the commission engine in your decision.
Leading vs. Lagging: Why Most MLM Dashboards Fail
A lagging indicator reports on the past. Total revenue last period. Number of new enrollments last month. Commission payout amounts. These numbers are important for accounting and compliance. They are useless for predicting what happens next.
A leading indicator signals what is about to happen. Login frequency dropping means distributor engagement is fading. Autoship cancellation rate spiking means recurring revenue will fall in 30 days. First-order-to-second-order conversion declining means the product is not retaining new customers.
The gap between leading and lagging metrics is where network marketing companies lose control. A founder sees revenue growing 5% month-over-month and assumes everything is fine. Meanwhile, 30-day activation rates have been dropping for three consecutive periods. New distributors are enrolling but not placing their first order. The tree is getting taller without getting productive. When the revenue impact finally shows up two months later, it is too late for a quick fix.
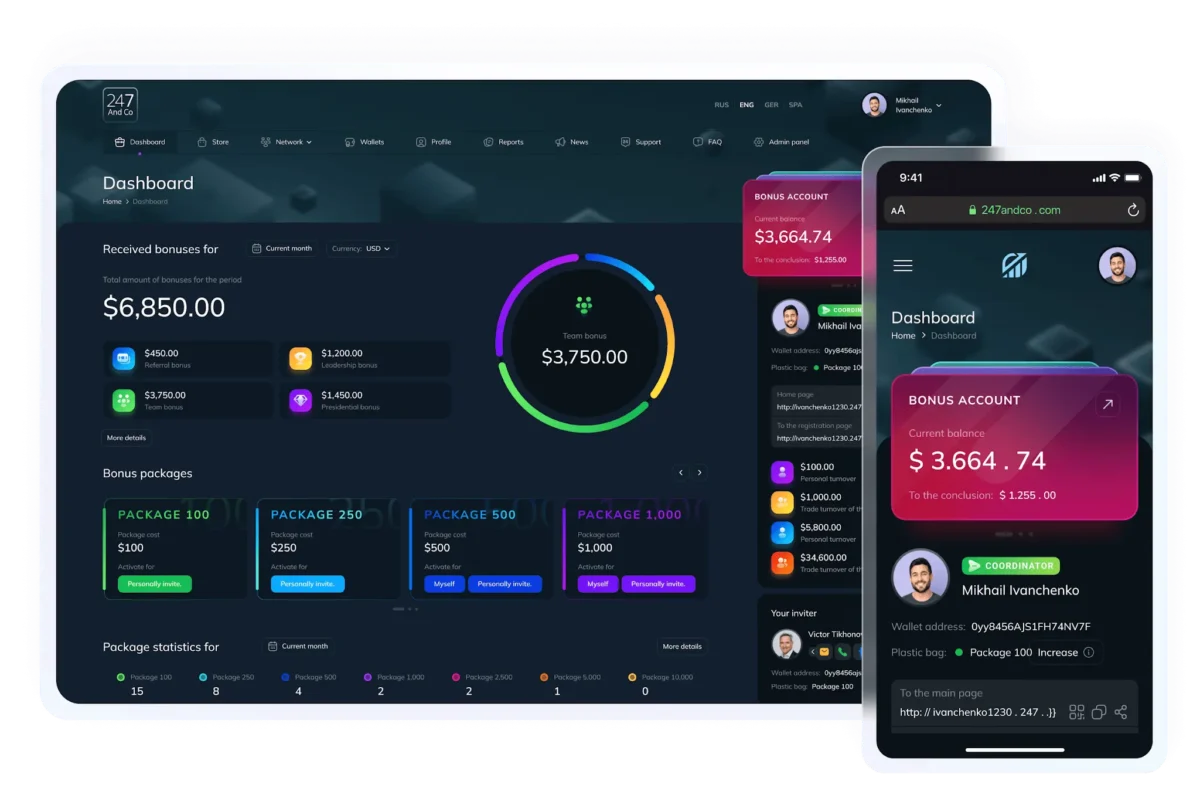
The best MLM software surfaces leading indicators alongside lagging ones on the same dashboard. Not buried in a sub-report that requires five clicks to find. Front and center, in the same view the CEO opens every morning.
Here is a practical example of how leading indicators work. A wellness MLM client of ours noticed their total enrollment numbers looked strong in Q3 2025: 2,400 new signups per month, up 12% from Q2. The lagging dashboard showed growth. But the 30-day activation rate had dropped from 68% to 51% over the same period. That meant 1,176 of those 2,400 enrollees never placed a first order. They were names in the database, not active distributors. By Q4, revenue flattened despite continued enrollment growth. The activation rate predicted it two months before the revenue number confirmed it.
When we surfaced activation rate on their executive dashboard, the operations team changed their onboarding flow within a week. They added a first-order incentive for enrollees who purchased within 72 hours of signing up. Activation rate recovered from 51% to 64% in six weeks. Revenue growth returned by January 2026. One metric change, displayed in the right place, drove a $180,000 quarterly revenue swing.
The 5 Metrics That Predict Network Health
We ran a correlation analysis across 62 FlawlessMLM client networks with at least 18 months of historical data. Five metrics showed the strongest predictive relationship with 90-day forward revenue.
| Metric | What It Measures | Correlation with 90-Day Revenue | Where Most Platforms Track It |
| 30-Day Activation Rate | % of new enrollees who place their first order within 30 days | 0.87 | Rarely tracked. Most platforms count enrollments only. |
| Daily Portal Login Frequency | Average logins per distributor per day | 0.81 | Tracked at server level but not surfaced on dashboards. |
| 90-Day Distributor Retention | % of distributors still active 90 days after enrollment | 0.79 | Some platforms show this. Few show it by enrollment cohort. |
| Autoship Renewal Rate | % of autoship subscribers who renew successfully each period | 0.76 | Usually tracked only as a total count, not as a rate trend. |
| First-to-Second Order Conversion | % of first-time buyers who place a second order within 60 days | 0.72 | Almost never tracked. Requires order sequence analysis. |
The 30-day activation rate is the single strongest predictor in our data. A network where 70% of new enrollees place their first order within 30 days will almost certainly grow. A network where that number falls below 40% will stall regardless of how many new people enroll. The enrollments look good on the lagging dashboard. The activation rate tells the real story.
“We stopped celebrating enrollment numbers three years ago. A new signup who never places an order is not a distributor. They are a data entry. The metric that matters is whether that person transitions from enrolled to active within 30 days. When we built activation rate tracking into our dashboards, our clients started making better decisions because they were looking at the right number.” Oleksandr Honcharov, CEO at FlawlessMLM
Daily portal login frequency ranks second. This metric captures engagement at a behavioral level. A distributor who logs into the partner portal software 3-4 times per day is actively selling, recruiting, and monitoring their team. A distributor who logs in once per week is coasting. When the average login frequency for a network drops below 1.5 per day, our data shows revenue will decline within 45 to 60 days.
Autoship renewal rate is the recurring revenue heartbeat. A 2% drop in renewal rate might seem small. But on a network with 30,000 autoship subscribers at $95 average order, a 2% decline means 600 fewer renewals per period. That is $57,000 in lost revenue per month, compounding forward. The rate trend matters more than the absolute number.
First-to-second order conversion rounds out the top five. This metric answers a simple question: does the product bring people back? A distributor or customer who buys once and never returns is not a retained user. They were curious. Repeat purchases signal product-market fit at the individual level. When conversion from first to second order drops below 35%, the product catalog or the onboarding experience needs attention. In our data, networks with a first-to-second conversion above 55% grow revenue 2.1x faster than those below 40%. The commission tracking software must track individual order sequences, not just aggregate volume, to calculate this metric correctly. Most SaaS affiliate software does not store order history at this level of detail, which is why multi-level affiliate program operators need purpose-built MLM analytics.
What Affiliate Reporting Cannot Do
SaaS affiliate software and affiliate tracking software track clicks, conversions, and payouts. For a flat referral program, that is sufficient. But the moment you add downline depth, the reporting requirements change completely.
MLM reporting needs tree-level analytics that affiliate management platforms do not offer. Group volume aggregation across the genealogy tree. Rank distribution showing what percentage of the network sits at each level. Branch health scores that identify which legs or downlines are growing and which are stalling. Depth-to-width ratios that reveal whether the tree is building productively or just getting tall without breadth.
Affiliate commission software calculates from the sale upward to one partner. Network marketing MLM software calculates from every position downward through the entire tree. The reporting layer must work the same way. A report that shows “Partner A earned $500 this period” is an affiliate report. A report that shows “Partner A’s left leg generated $42,000 in group volume across 340 active positions, with 12% of those positions at risk of inactivity based on login trend analysis” is an MLM report.
For companies running a multi-tier affiliate program that involves two or three commission levels, the reporting needs fall between affiliate and full MLM. The analytics must at least track downline activity and volume contribution by level. Most referral software cannot do this because the data model does not include hierarchical relationships.
Churn Prediction: From Reactive to Proactive
The most valuable analytics feature in modern MLM software is churn prediction. Instead of finding out that a distributor went inactive after they stopped logging in, a churn model identifies who is likely to leave 2 to 3 weeks before it happens.
The model analyzes multiple signals: declining login frequency, order volume dropping below the personal qualifier threshold, autoship modifications (switching to cheaper products or reducing quantity), and team activity falling in the distributor’s immediate downline. Each signal carries a weight. When the combined score crosses a threshold, the system flags the distributor as at-risk and triggers an intervention workflow.
What makes churn prediction valuable for MLM specifically is the network effect of losing a single distributor. In a flat affiliate model, losing one partner costs whatever revenue that partner generated. In a binary or unilevel MLM structure, losing one distributor can destabilize an entire branch. Their downline loses an active upline mentor. Group volume drops for every position above them. Rank qualifications for sponsors up the tree may fall short because of the missing volume. The cascading damage from one lost distributor can affect dozens of positions. Churn prediction catches that cascade before it starts.
We trained our model on behavioral data from 280,000 distributor profiles across 42 FlawlessMLM client networks. The model achieves 78% accuracy in predicting 30-day churn, meaning that 78% of distributors it flags as at-risk actually do go inactive if no intervention occurs. That accuracy level makes the intervention workflow reliable enough to automate for the majority of cases.
Intervention can be automated (a personalized email from the company with a promotion or training resource) or human-driven (the distributor’s upline receives a notification with suggested talking points). The approach depends on the distributor’s rank and value to the network. A top earner gets a personal call from the company president. A mid-tier distributor gets a targeted offer. A new enrollee gets an onboarding reminder.
GreenLeaf Wellness Case Study: Analytics-Driven Retention
GreenLeaf Wellness, a supplement MLM with 26,000 active distributors, added the FlawlessMLM churn prediction module in March 2025. Before the module, their 90-day retention rate was 44%. The operations team had no way to identify at-risk distributors until they had already missed two consecutive autoship renewals.
Our churn model analyzed 14 behavioral signals for each distributor and generated weekly risk scores. Distributors scoring above the 75th percentile received automated re-engagement emails with product recommendations based on their order history. Distributors scoring above the 90th percentile triggered a notification to their upline sponsor with a suggested action plan.
Results after 8 months:
- 90-day retention rate: from 44% to 58% (a 32% improvement)
- At-risk distributors saved per month: average 340 out of 1,200 flagged (28% save rate)
- Revenue recovered from saved distributors: $4,800/month per 10,000 active positions
- Autoship renewal rate: from 81% to 89%
- Total additional revenue attributable to churn prevention in first 8 months: $384,000
The churn prediction module cost $12,000 to implement. It generated $384,000 in recovered revenue in 8 months. That is a 32x return on investment.
Building the Right Dashboard Stack
At FlawlessMLM, we build three reporting layers into every platform.
- Executive dashboard: A single screen showing the 5 leading indicators plus revenue, enrollment count, and payout total. Updated in real time. Designed for a 30-second scan that tells the CEO whether the network is trending up, flat, or down.
- Operations dashboard: Drill-down views for the team managing daily business. Commission run status, autoship processing results, support ticket volume by category, and integration health checks. This is the command center for the people running the platform day to day.
- Distributor analytics: The partner portal view that shows each distributor their personal metrics. Earnings trend, rank progress, team activity, and goal tracking. This layer drives individual behavior. A distributor who sees they need $127 more in personal volume to hit the next rank will make those sales today.
Standard reporting dashboards are included in every FlawlessMLM build. Advanced analytics modules including churn prediction, rank path optimization, and custom KPI builders cost $5,000 to $15,000 depending on scope. BI tool integration through the API costs $2,000 to $4,000.
According to the Direct Selling Association, only 23% of network marketing companies use predictive analytics in their operations as of 2025. Companies that do report 18-30% higher distributor retention than industry averages. The analytics gap represents a major competitive opportunity for companies willing to invest. (DSA Technology Survey, 2026)
FlawlessMLM holds a 4.9 rating on Clutch. We have delivered over 400 network marketing software projects since 2005. Our reporting architecture feeds data from the commission tracking software, partner management system, and autoship engine into a unified analytics layer. The best network marketing software does not just calculate commissions accurately. It tells you where the network is going before you get there.
We offer a free analytics assessment. Our team will review your current reporting setup and identify the leading indicators your dashboard is missing.
FAQ
What metrics should MLM software track?
The most predictive metrics are 30-day activation rate, 90-day distributor retention, autoship renewal rate, average order value, and daily partner portal login frequency. These are leading indicators that predict what will happen in the next 60 to 90 days. At FlawlessMLM, our dashboards prioritize leading indicators because they give operators time to intervene before problems become losses.
How does MLM reporting differ from affiliate program reporting?
Affiliate program software tracks clicks, conversions, and payouts at the individual partner level. MLM reporting adds tree-level analytics: group volume aggregation across the genealogy, rank distribution, downline depth and width ratios, and team-based activity patterns. These metrics do not exist in affiliate tracking software because flat referral programs have no hierarchical structure.
Can I export MLM reporting data to Excel or a BI tool?
The best MLM software includes built-in dashboards and data export. At FlawlessMLM, every report exports to CSV and connects to Tableau, Power BI, or Looker through our API. We also offer scheduled report delivery via email for executives who prefer weekly summaries.
What is a churn prediction model in MLM software?
A churn prediction model uses machine learning to identify distributors likely to go inactive within 30 to 60 days. It analyzes login trends, order pattern changes, autoship cancellation signals, and team activity drops. At FlawlessMLM, our model flags at-risk distributors 2 to 3 weeks early. Intervention saves 18 to 24% of flagged distributors.
How much does MLM analytics and reporting cost?
Standard dashboards are included in every FlawlessMLM build. Advanced analytics with churn prediction and custom KPIs cost $5,000 to $15,000. BI tool integration costs $2,000 to $4,000. The ROI is measurable: clients using churn prediction save an average of $4,200 per month per 10,000 active positions.
Also Read
- Innovative Technologies in Metalworking Equipment
- The Professional Caregiving Solutions are Designed to Improve Quality of Life
- What Is a 3D Scanner? Common Misconceptions and the Reality Behind Modern Scanning Technology







Leave a Comment